Team & territories
Reports
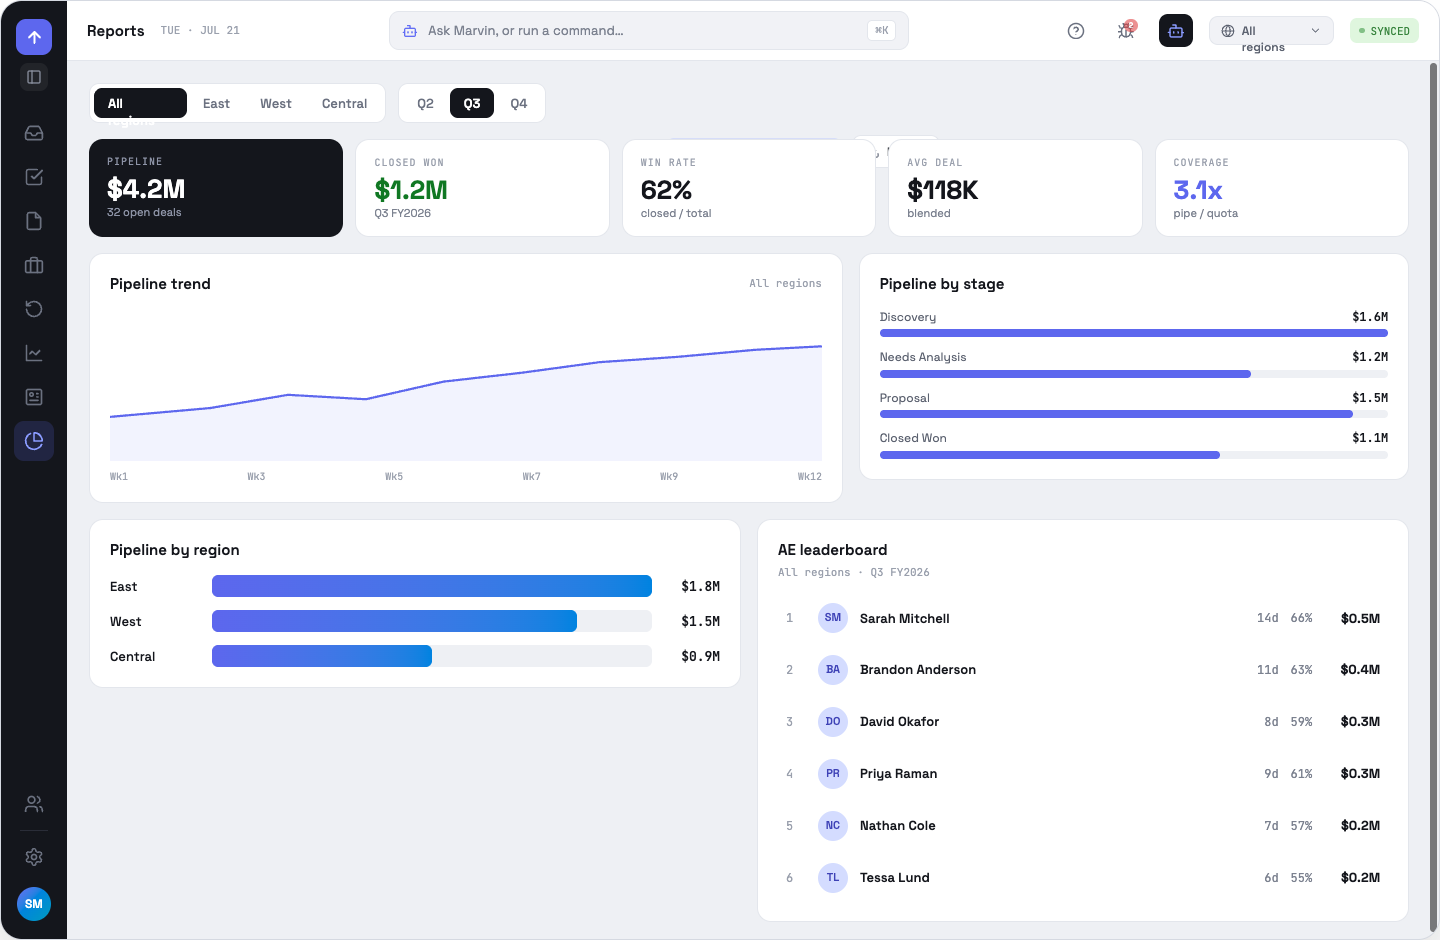
Five KPIs and four charts, all recomputed for whatever region, sub-region and quarter you pick.
Filters
The region segment comes first; picking one reveals its sub-region chips and resets any previous sub-region choice. Quarter is independent. Everything below recomputes server-side per combination — nothing here is a client-side slice of a bigger number.
What is on the page
KPIs
Pipeline, closed won, win rate, average deal, and coverage — pipeline over the team’s submitted forecast commit for the period, which is what stands in for a quota here.
Pipeline trend
Per-week pipeline with a cumulative closed-won series overlaid on the same chart.
Pipeline by stage
Discovery through closed won, as amounts.
Breakdown
By region, or by sub-region once you narrow to one region.
AE leaderboard
Only AEs — managers and SEs carry no quota, so including them would make the ranking meaningless.
OppFlow.ai docs · by Traversal · v0.1.32